Baseball Analytics Platform
27Outs
Real-time analytics for coaches and analysts
40+
Advanced Metrics
Real-time
Event Processing
Multi-view
Dashboard Access
Overview
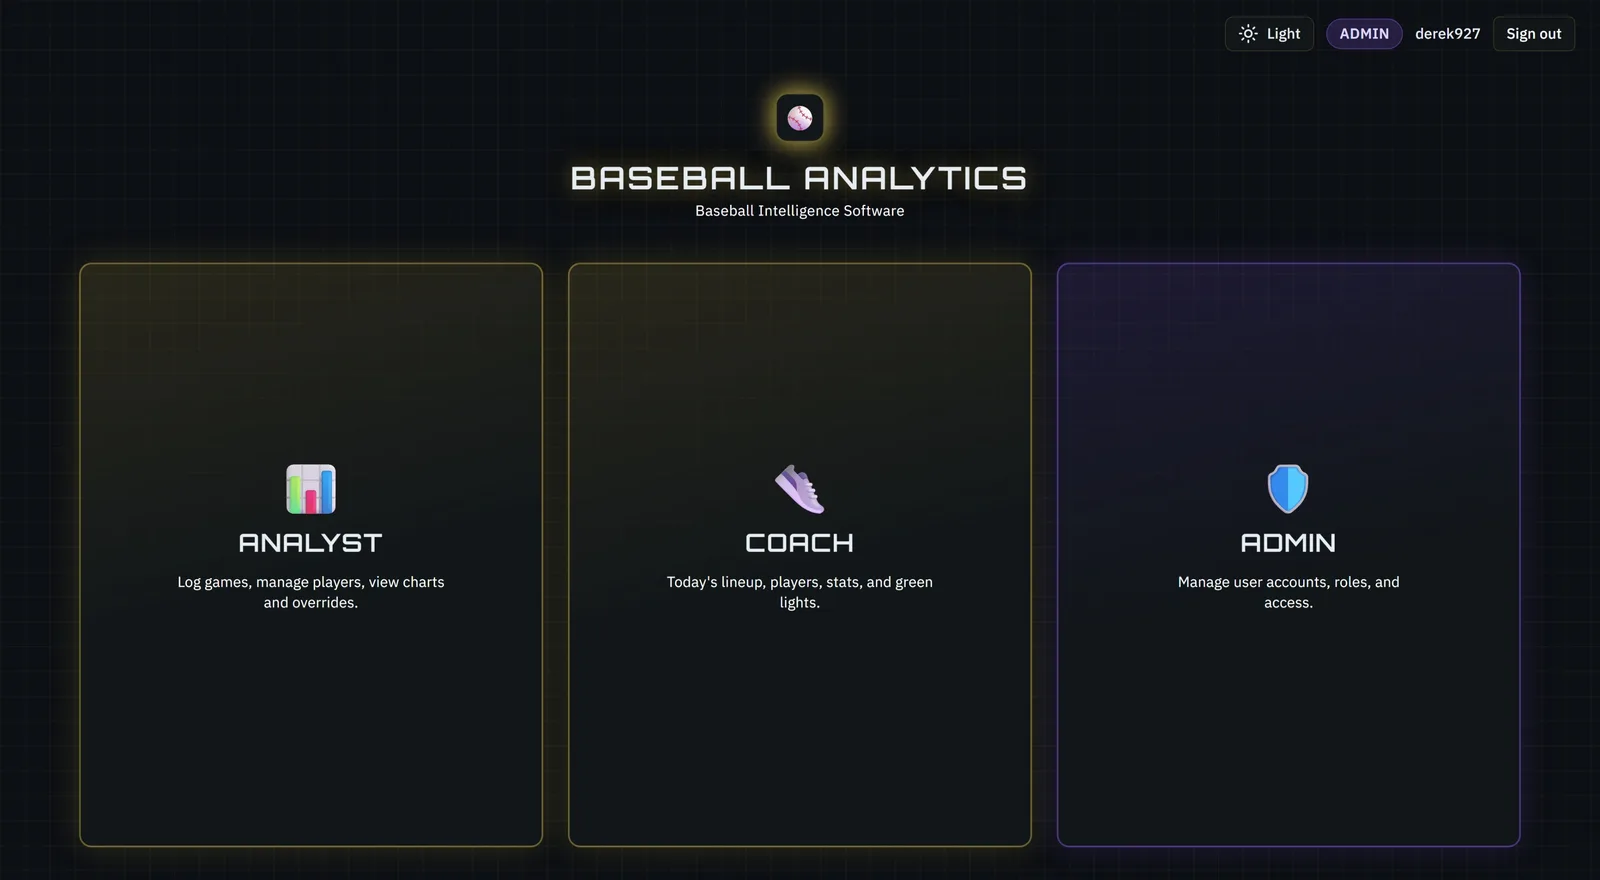
27Outs is a data-driven baseball analytics product built to help coaching staffs move beyond box scores. The platform ingests granular game events and surfaces advanced metrics — pitch velocity trends, situational performance, and player comparisons — in dashboards designed for fast decision-making during and after games.
The Problem
Coaching staffs often rely on delayed, aggregated statistics that don't reflect in-game context. Pitch-by-pitch data exists but is difficult to access, interpret, and act on without dedicated analytics tooling.
The Solution
27Outs centralizes game event data into a purpose-built analytics platform. Coaches can filter by situation, compare players across metrics, and identify performance patterns without exporting spreadsheets or waiting on manual reports.
Key Features
- —Pitch-by-pitch event ingestion and normalization
- —Advanced metric calculations (velocity, spin, situational splits)
- —Interactive player and team comparison dashboards
- —Responsive layouts for desktop and tablet sideline use
- —Export-ready reports for post-game review
Architecture
Client-server architecture with a React/Next.js frontend, API layer for metric computation, and PostgreSQL via Supabase for structured event storage. Server components and edge deployment on Vercel keep dashboard loads fast.
Tech Stack
Database Design
Relational schema organized around games, innings, at-bats, and pitch events. Indexed query paths support filtering by player, date range, and pitch type. Aggregated views pre-compute common coaching queries.
Technical Challenges
- Normalizing heterogeneous Statcast-style event formats into a consistent schema
- Computing rolling metrics efficiently across large pitch datasets
- Balancing dashboard richness with sub-second load times on mobile networks
Lessons Learned
- →Domain-specific UX matters as much as the analytics — coaches need answers in seconds, not clicks
- →Pre-aggregation beats on-the-fly computation for frequently accessed metrics
- →Designing the data model around coaching questions simplifies every downstream feature
Future Improvements
- • Live game feed integration with automatic metric updates
- • Custom report builder for scouting departments
- • Role-based access for staff, players, and front office
- • ML-powered pitch sequence recommendations